jam2jam Visualize software

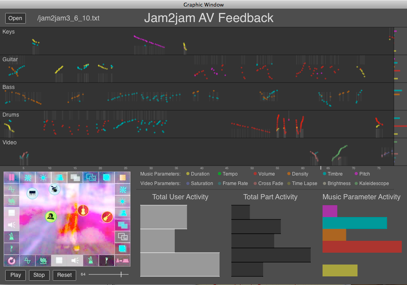
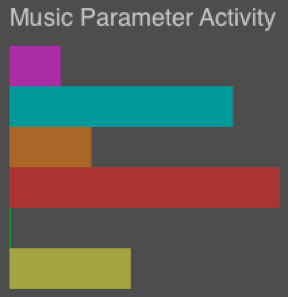
The jam2jam AV visualize software displays the gestural data collected during a jam. It also displays statistical summaries (histograms) of that data, and includes the video recording of the jam as a reference. The Visualize software provides opportunities to enhance reflection, discussion and analysis of jam2jam performances.
Performances with jam2jam AV can be recorded as videos that capture the screen and the music. In addition, when recording, a textual data log is generated that captures all the interface changes of all participants in the jam. Data collected includes the user ID, time stamp, parameter moved, and parameter value. It is this data that is displayed by the Visualize software.
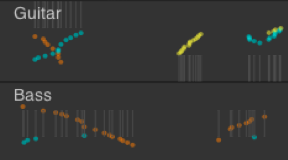
There are four main characteristics in the log data, users (as many as are currently logged in), parts (4 musical and 1 video), parameters and parameter values. In order to represent these multiple dimensions the interface design relies on familiar tropes and metaphors; in particular musical tracks and statistical histograms. Information in the upper ‘track’ section is also conveyed by event location and colour, while parameter values and user indicators are overlaid.
Jam2jam AV software is often used by children and youth in community arts and school settings. In these settings, especially in schools, jam2jam activities are designed to assist with learning about music and media concepts and about improvised ensemble/group collaboration. The Visualize software was developed to better support reflection on performances in order to assist these pedagogical objectives.
It is likely that the user’s visual acuity is more advanced than their musical perception and therefore the visualisation and its synchronisation with the musical output can assist with reflection that leads to the development of aesthetic awareness and ensemble skills.
The significance of patterns in the numerical data is much more evident when visualized as our perceptual processes are highly biased toward visual pattern recognition.
The task of graphically representing the performance gestures bears some relation to the task of notating music. It is a symbolic description of the events leading to the musical (audio visual) outcome. The task of visualizing parameter change gestures in jam2jam can be seen as a type of score writing in this way. However, it differs importantly from CPN or MIDI because of the generative nature of jam2jam music production and the ongoing video playback which mean that there is not a one-to-one correspondence between gestural events and media outcomes. Rather the gestures change algorithmic parameters that mould and shape the ongoing media output.
The mappings of the log data used by the jam2jam Visualize software include assumptions about what is important in the performances, about the jam2jam system, about levels of detail and scale, and aesthetic choices about clarity and readability.
The Visualize software has only minimal interaction. This consists of loading a new data set, setting the video playback location and playing back the video. An animated marker shows the current playback position on the track timeline so that the alignment of gestures with audio visual outcome can be seen. This design for minimal interaction focuses the user on reading and interpreting the feedback. This is possibly at the expense of dynamic data reorganisation that may assist sense making, but it was decided to keep possible distractions to a minimum.
About jam2jam visualize
The jam2jam visualize software provides a display of activity data collected during a jam and aligns it with playback of a video recording of the jam.